
Infographics are still a compelling way to visualize information and tell a story through imagery, text, and data. But, with so many different components to consider, learning how to make an infographic can be time-consuming and overwhelming.
With the help of PicMonkey’s versatile tools, you can easily make an infographic by starting with our designer-made templates or crafting one from scratch — all in just five easy steps.
Create an infographic with a template
1. Search through infographic templates for inspiration
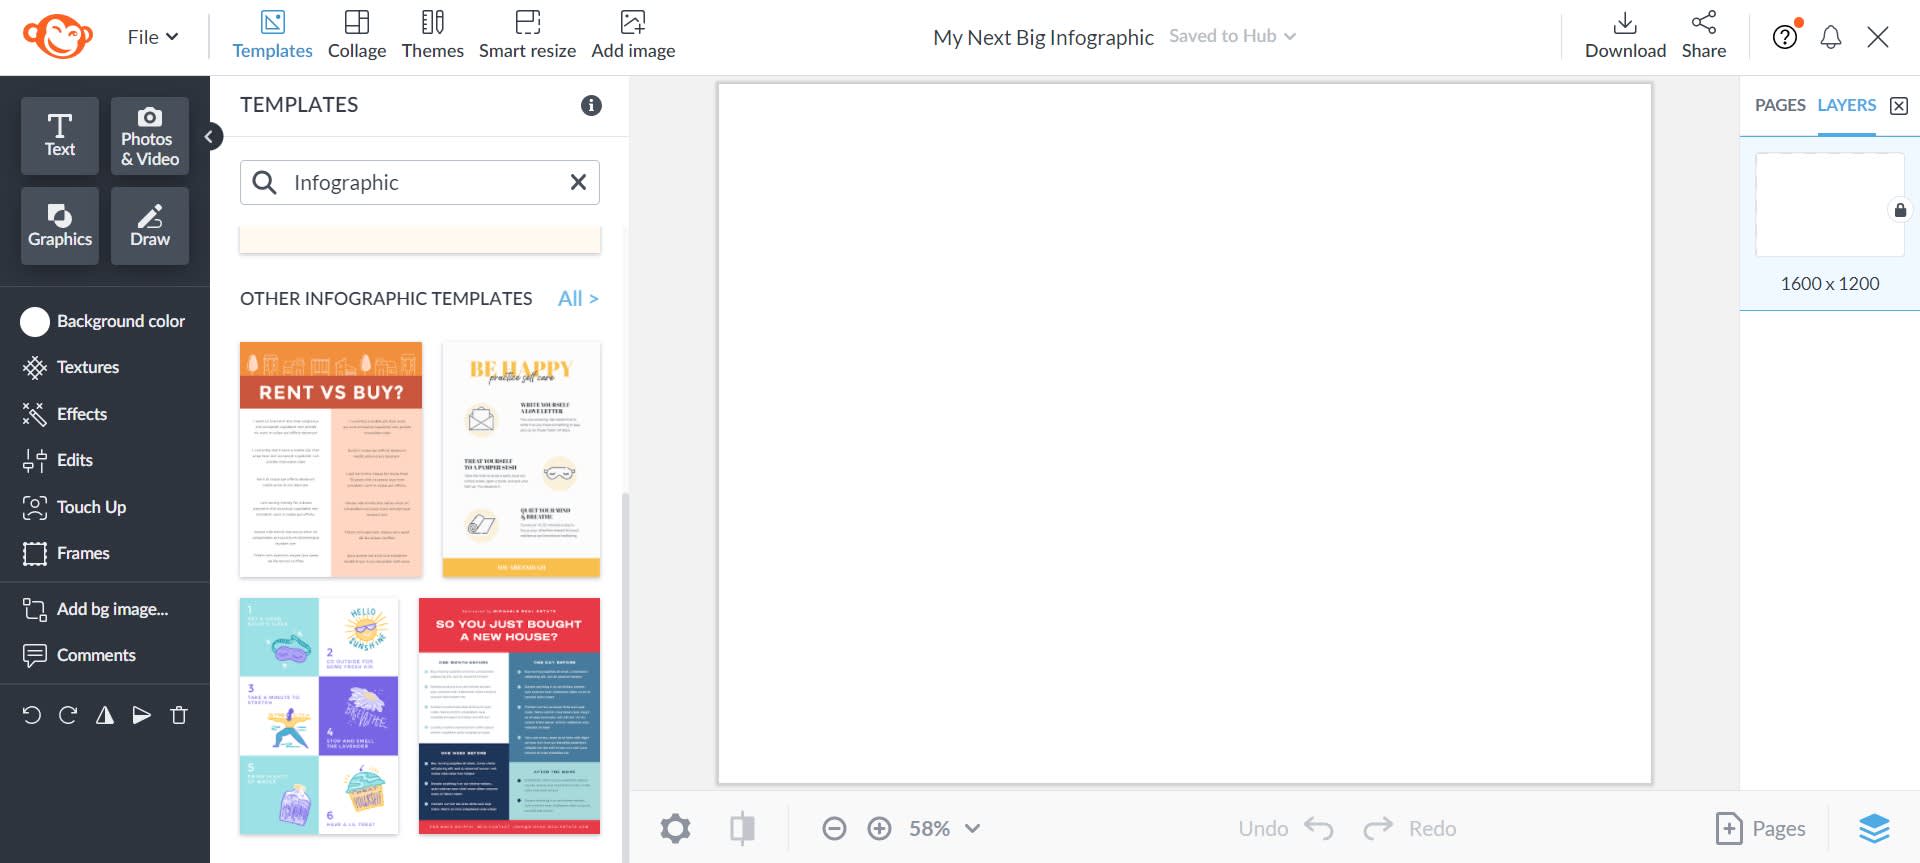
PicMonkey houses tons of editable infographic templates, right at your fingertips—giving you extra inspiration for your next design. Click the Templates button at the top of the PicMonkey Editor and scroll through a selection of professional templates for every occasion. Each template is already crafted—from the specific dimensions to the layout and typography—all you need to do is customize.
2. Customize typography and content
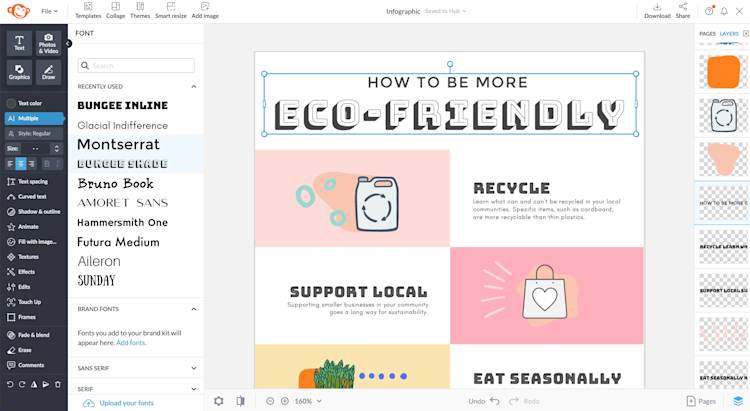
The fonts you choose for your infographic impact its overall appearance and often sets the tone for your content. When choosing typography for the infographic title, headlines, and copy, stick to no more than three typefaces.
Click the text layer you'd like to change, then use the Text Tools menu to change its appearance. PicMonkey contains a vast library of typefaces, all categorized by style: serif, sans serif, handwriting, script, display, and monospaced.
When choosing your typefaces for your infographic design, choose fonts that complement each other, such as Montserrat and Bungee Shade. For copy text, opt for a simplistic typeface in serif or sans serif for easy readability.
3. Add graphics or import your own
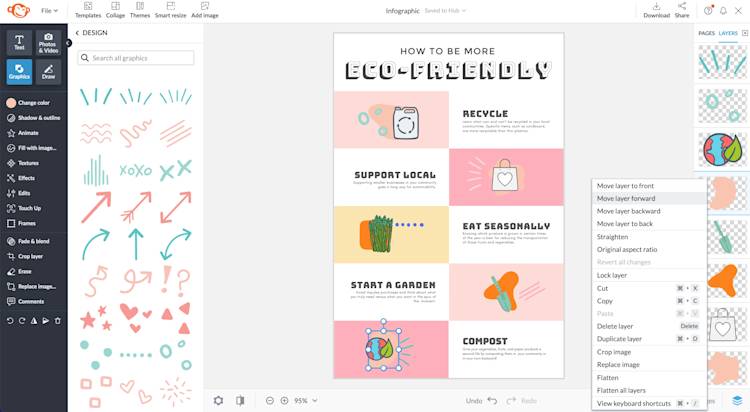
What’s an infographic without engaging visuals? While PicMonkey already has example design elements in each template, you can easily swap them out to suit your infographic. Simply head to the Graphics tab on the left-hand side to search through several categories, ranging from accent graphics to more specific lifestyle and illustrative icons. Use the search bar for specific illustrations or dive into each category to curate your own selection.
TipMonkey: When using multiple stacked graphics, head to the Layers panel on the right-hand side and drag individual design elements upwards or downwards to change the overall layer order.
To import your own custom graphics, click on the Graphics tab and then select Add Your Own Graphic.
4. Change overall colors
Editing the overall color palette of your infographic not only allows the design to convey meaning through color but also to be cohesive, especially if you are designing within a specific brand palette. In this eco-friendly infographic, a selection of green hues is better aligned with the topic.
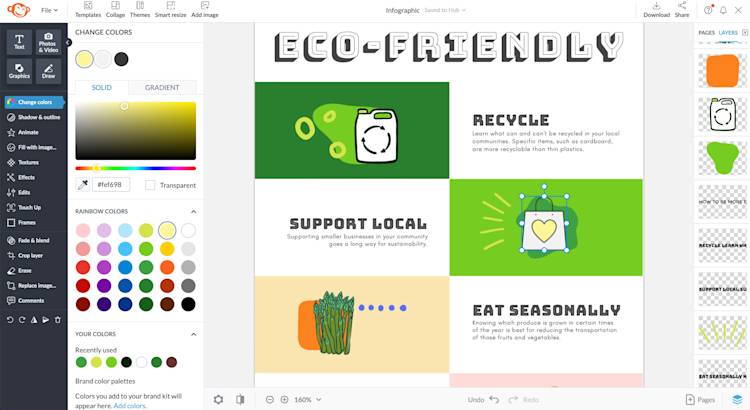
In PicMonkey, you can easily change out the color of each individual design element, down to the graphic’s outline, fill color, and accent color. Select the graphic you’re editing and then the Color Picker menu will expand, giving you the opportunity to customize each individual element. From here, you can choose from a selection of varying solid and gradient hues, add in your custom colors, or input specific hex codes for the colors you want. To inject some transparency into your icons, check the Transparent option.
5. Download, export, and share!
Once you’re finished with editing your design, it’s time to share your infographic with the world! To download directly to your computer, hit the Download button on the top toolbar, then choose from Download as a JPG or PNG.
If saving for print purposes, our PicMonkey Pro subscription enables you to save your infographic as a PDF.
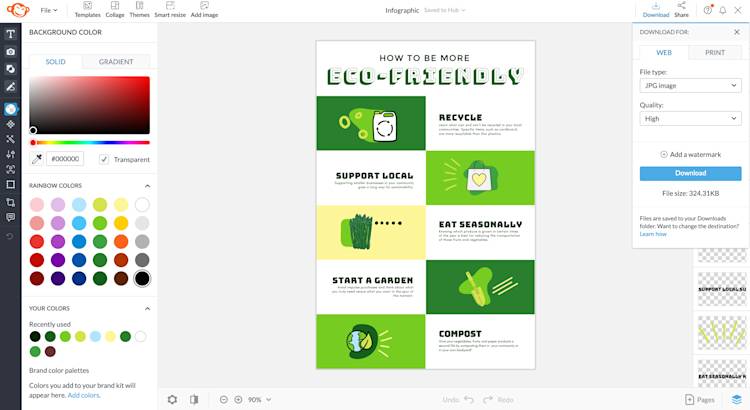
If you’re interested in sharing your design directly to social media, hit the Share button and then select your social media platform (you'll need to link your social profile if you haven't already).
For use across multiple social media platforms, resize your infographic (with no distortion) using our Smart Resize Tool.
TipMonkey: Notice how the left tools menu is thinner in the above image? Clicking the small, pointed arrow at the top of the menu will give you more space. To expand, just hover near the top and click the arrow again.
Now, let’s create an infographic from scratch.
How to make an infographic from scratch
1. Open a blank canvas
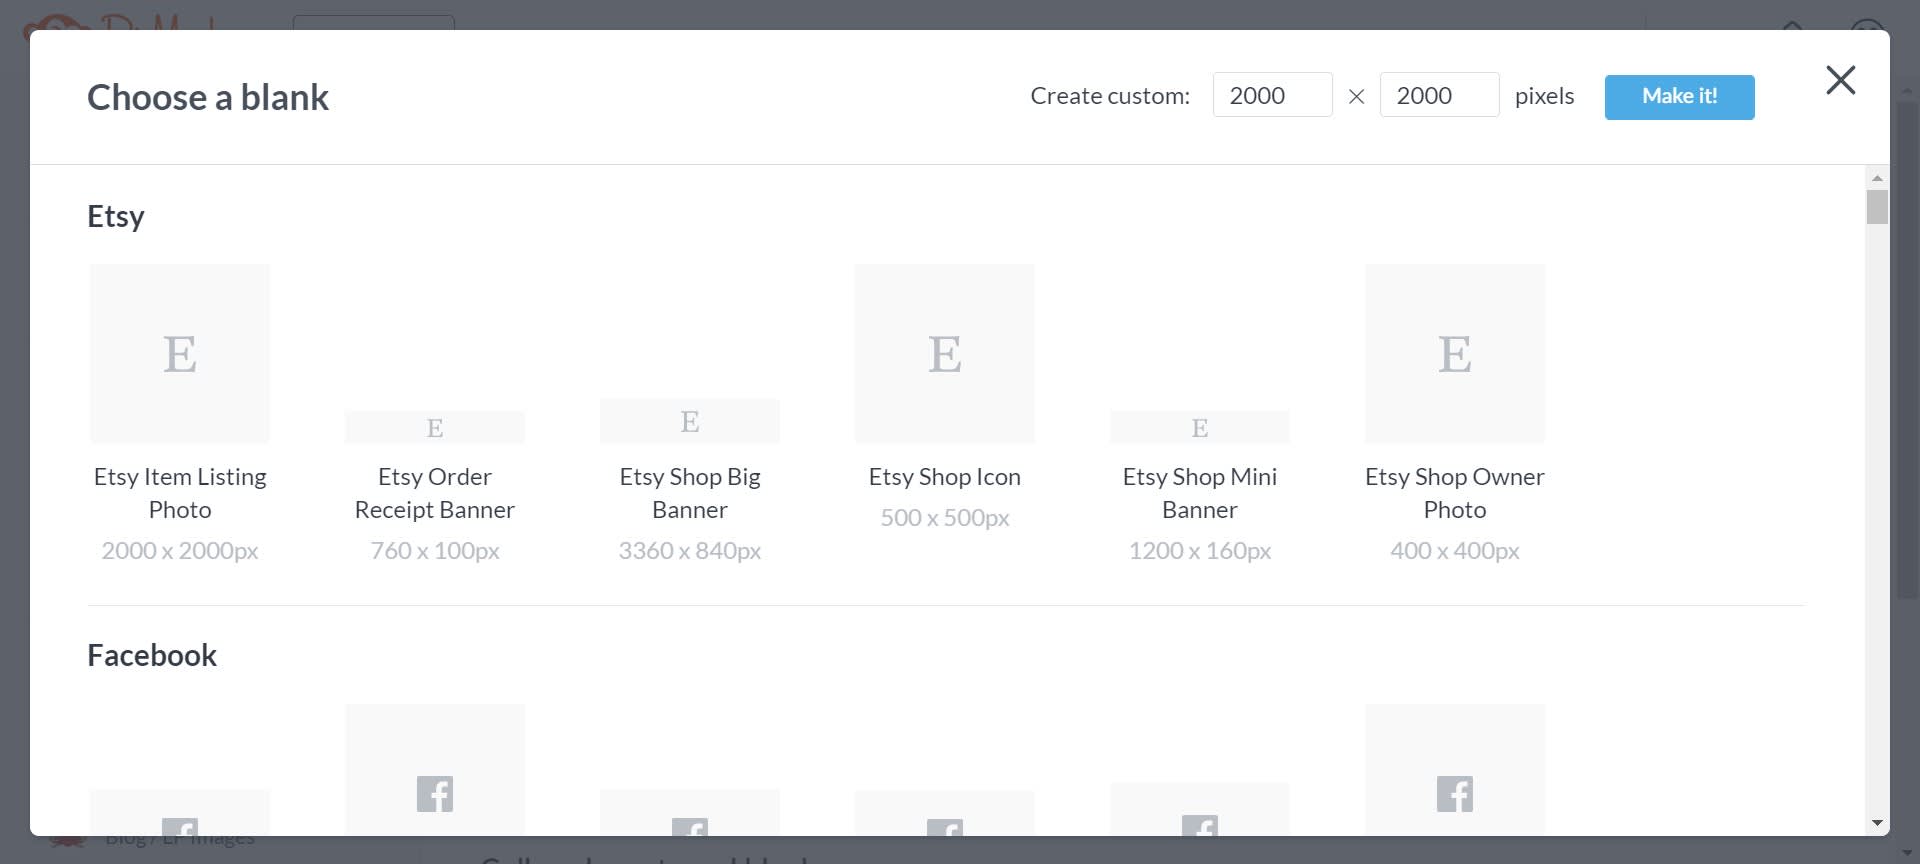
When creating your own infographic, there are many aspects to critically think about before getting to the base of the design. Start off by setting your dimensions or selecting from set dimensions by going to File > Create New > Blank Canvas. From there, you can select from an array of preset layouts or customize your infographic size in pixels or inches. For most infographics, opting for a vertically-oriented layout is ideal.
2. Add a catchy title
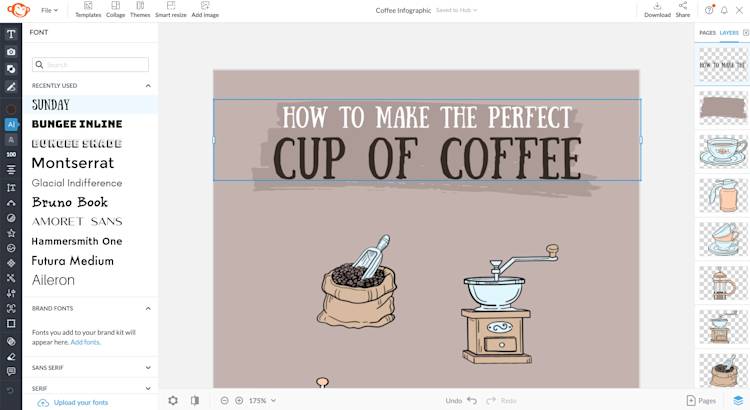
The title of your infographic is important in setting the stage for the remainder of your design. Think about the content of your design, then set your font styles accordingly. In a “How to Make the Perfect Cup of Coffee” infographic, a whimsical font such as Sunday contributes to the playfulness of the design.
To add more character (and more emphasis!) to the title, insert an accent graphic such as a brushstroke texture from our Graphics library.
3. Assemble your graphics
No infographic would be complete without eye-catching illustrations and visuals; they’re crucial to conveying the content of your infographic while providing breaks between paragraphs.
If you’re keen on dragging and dropping existing illustrations, PicMonkey’s graphics library is chock-full of stunning illustrations for your design. Filled to the brim with different categories such as coffee elements, brushstroke elements, patterns, and more, you simply can't go wrong in finding something to use.
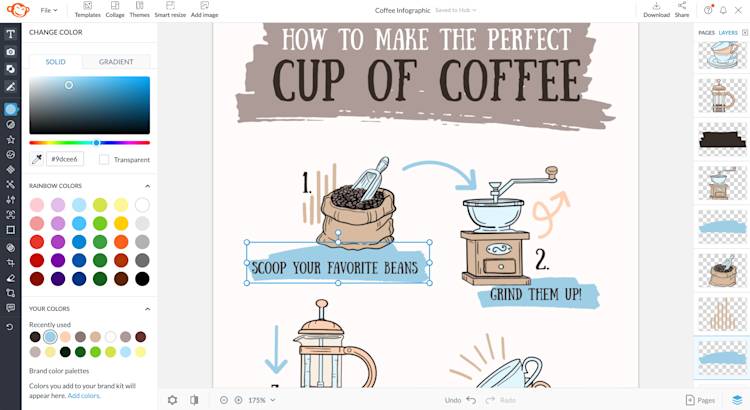
TipMonkey: Use accent or texture graphics, such as brush strokes and arrows, to add visual interest and allow readers to follow your infographic easier.
Adding a nature-themed graphic gives off a different meaning than abstract geometric icons. Importing eye-catching graphics doesn’t just add compelling visuals but also adds symbolism, giving your infographic additional meaning.
4. Add engaging and concise copy

The key to a successful infographic is engaging and concise copy. Long and lengthy pieces of text can interfere with the intent of the infographic and prompt readers to skip through the design. If you’re designing a step-by-step infographic, keep the copy short and sweet.
TipMonkey: Duplicate text or design elements with CMD + D to streamline your infographic workflow (CTRL + D for PCs).
5. Download and share!
When you’re ready to share your infographic with the world, share it directly to your social media or share the link to your graphic. To save the infographic directly, download it as a JPG or PNG in high quality.
